

One of the first operational concepts you'll encounter when building AI applications is rate limiting. Unlike traditional APIs, modern AI platforms don't simply limit the number of requests or account credits. Instead, they manage capacity across multiple resources, each representing a different aspect of model usage.
For example, while working with the Claude API, the rate limits are measured across three separate dimensions:
Requests Per Minute (RPM)
Input Tokens Per Minute (ITPM)
Output Tokens Per Minute (OTPM)
These appear to be operational limits designed to protect API capacity. But they also look like observability signals. All these days, systems are measured through metrics such as CPU, memory, latency, throughput, and error rates.
AI systems introduce an entirely new set of resources that need to be measured.
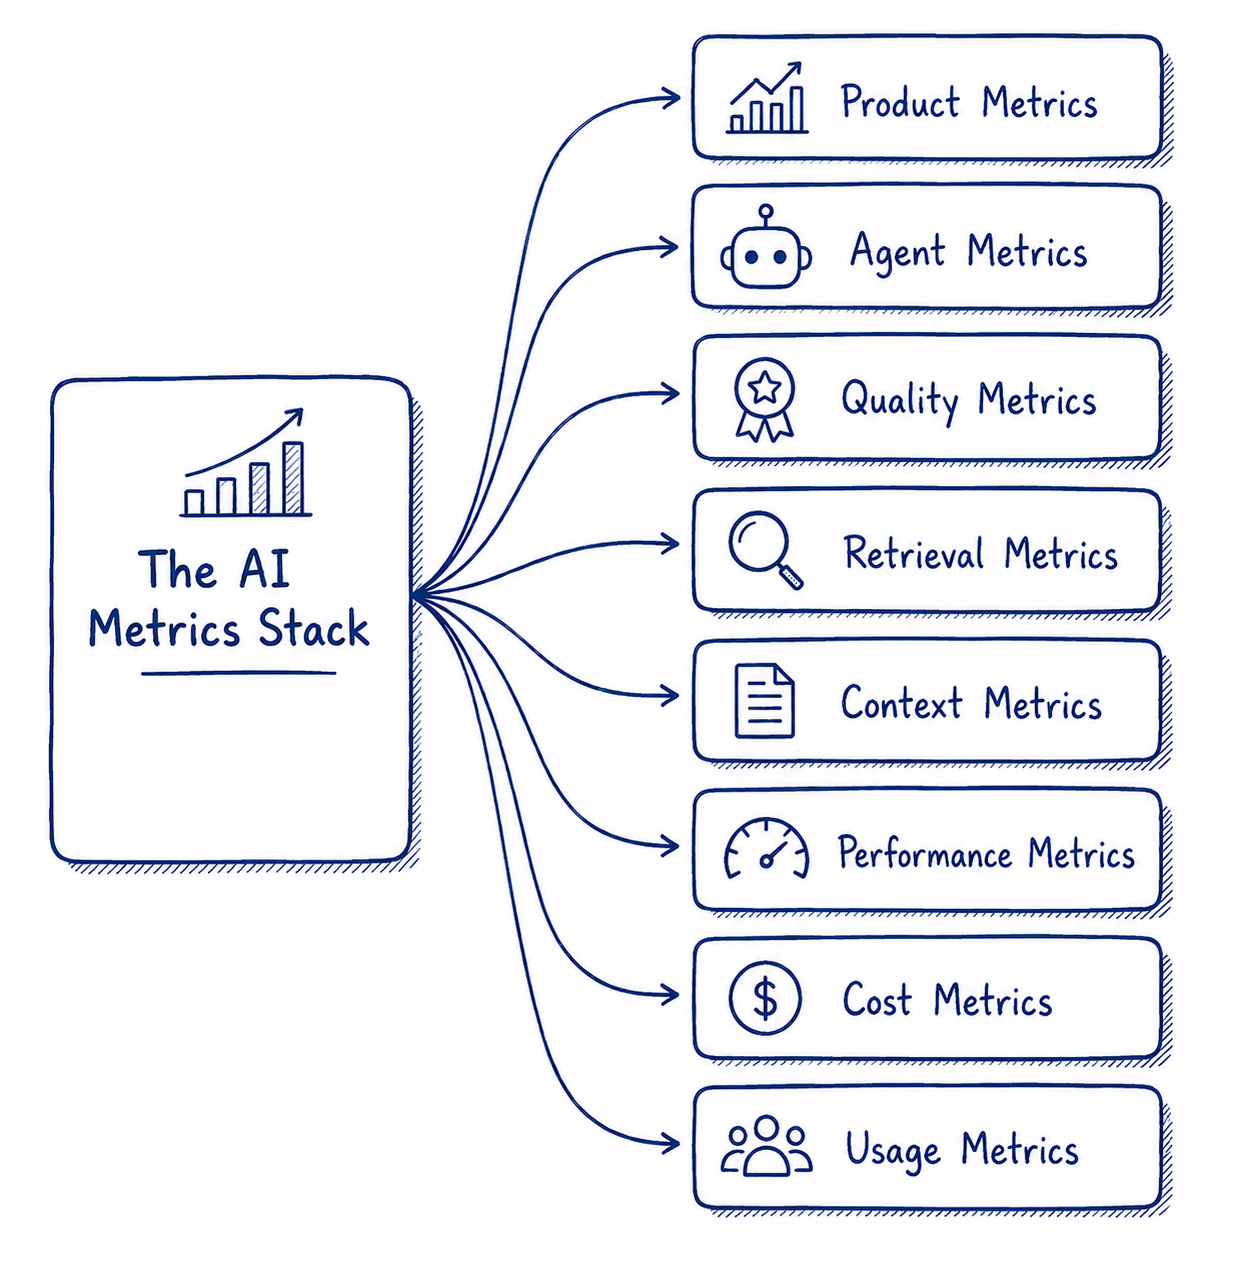
Beyond rate limits, there is an entire ecosystem of metrics that help us understand usage, cost, performance, retrieval quality, agent behavior, and reliability.
Let’s explore the key AI metrics every software engineer should know.
While many of these metrics are fairly intuitive, I'll focus on the ones that are most useful for understanding how AI systems are built, operated, and optimized.
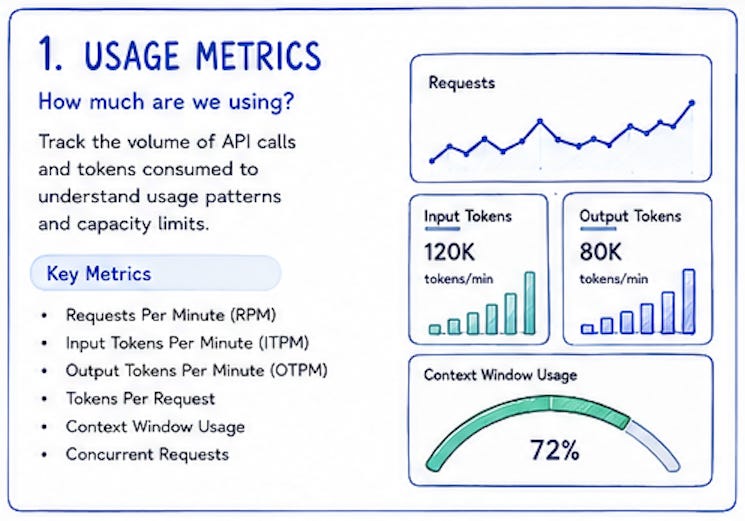
1. Usage Metrics
These are the metrics most API providers expose.
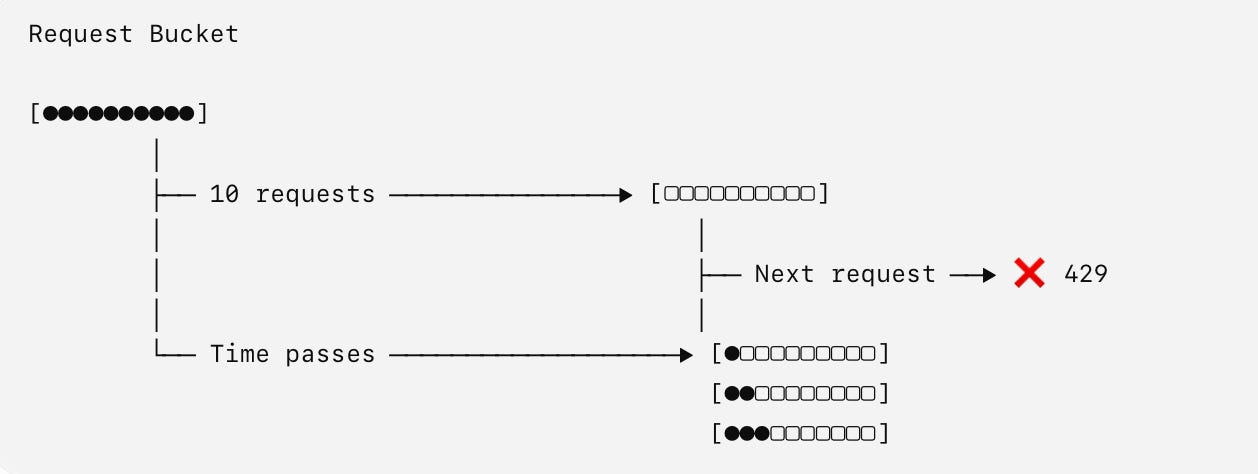
Requests Per Minute (RPM): Limits the number of API requests you can send per minute. Claude enforces this using a token bucket algorithm, where request capacity is continuously replenished instead of resetting every minute.
Example : Each API request consumes one token.
Input Tokens Per Minute (ITPM): Limits the total number of input tokens your application can send to the model each minute. Every request contributes to this budget, including system prompts, conversation history, retrieved documents, and user prompts.
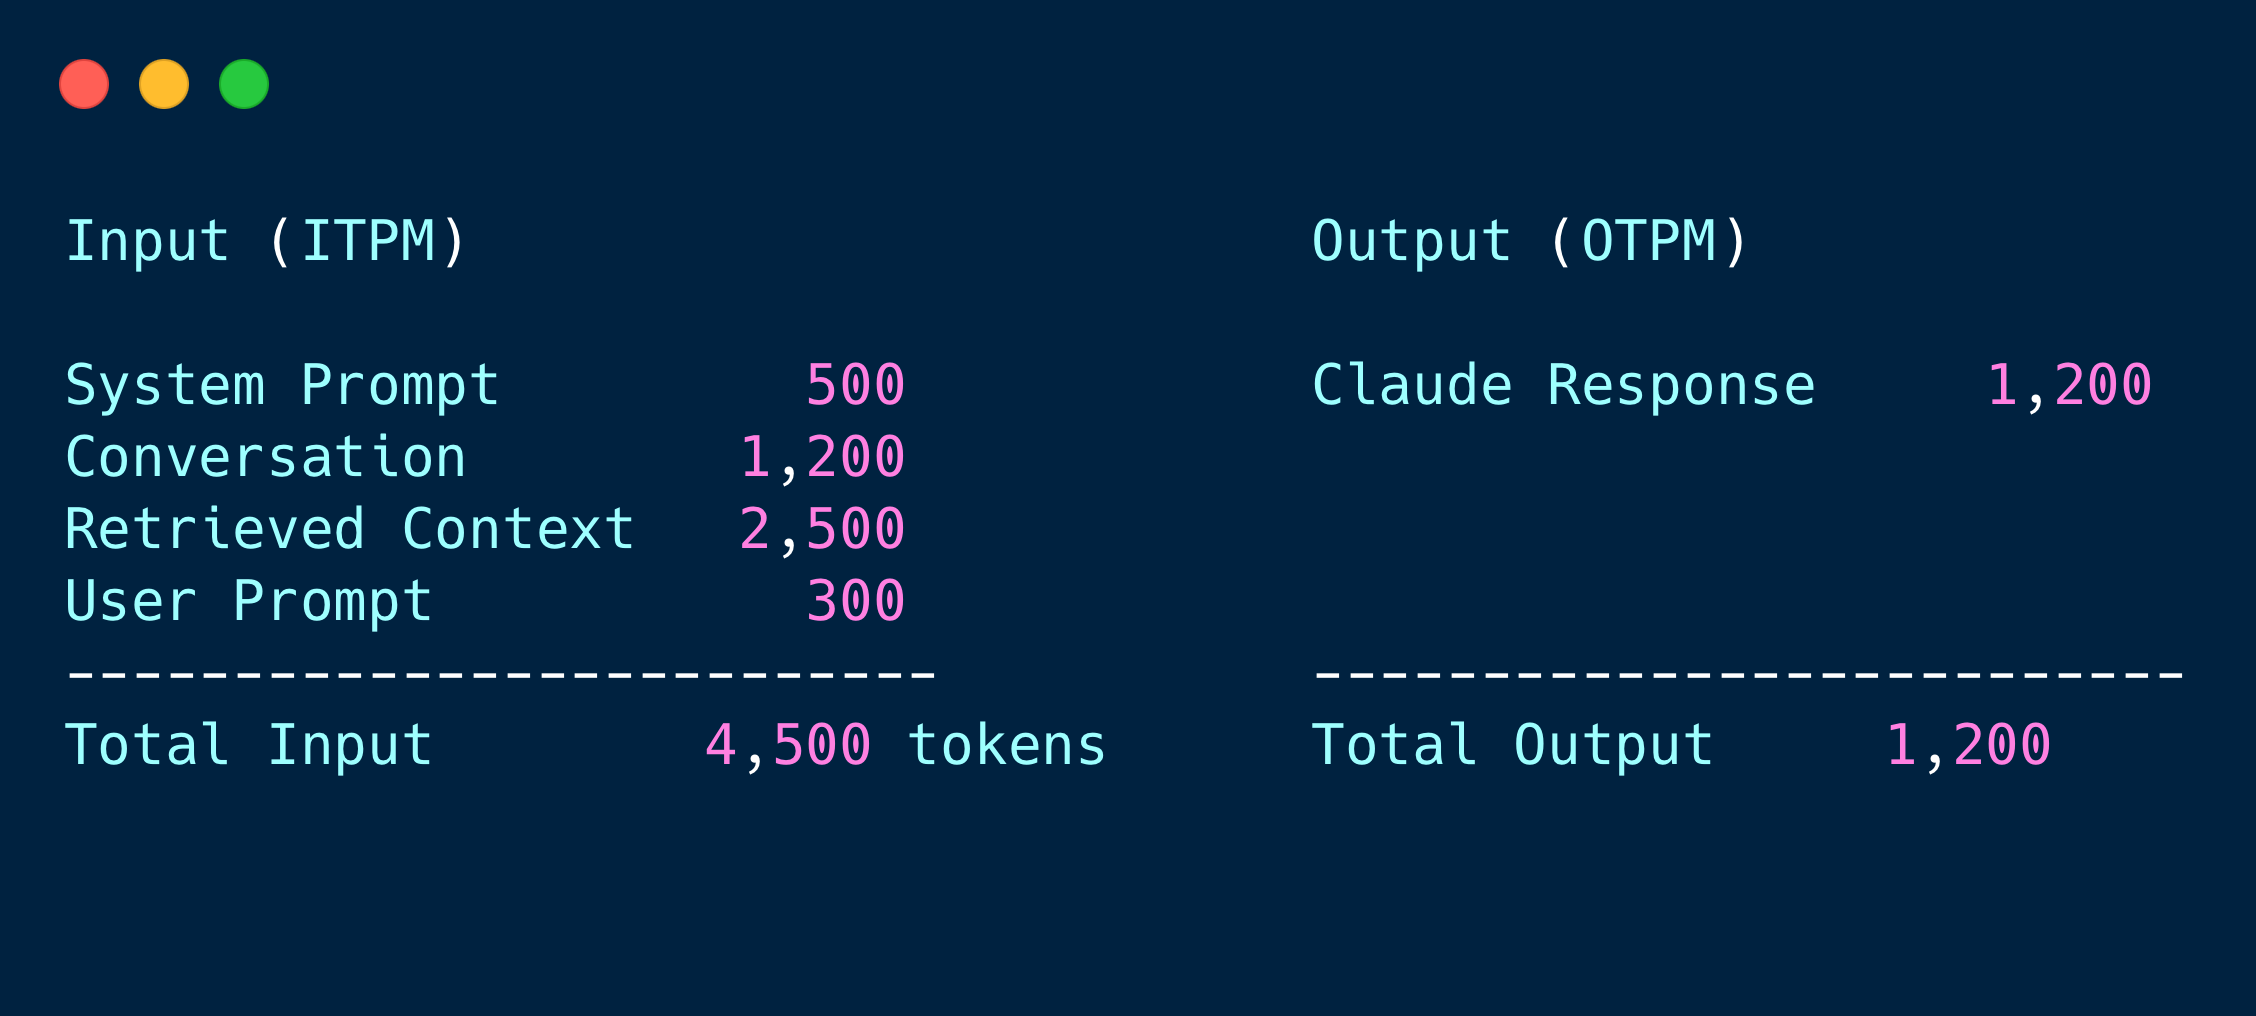
Output Tokens Per Minute (OTPM): Limits the total number of tokens generated by the model each minute. It's commonly the bottleneck for workloads that produce large outputs, such as code generation, summarization, and agent reasoning.
Context Window Usage: Measures how much of the model’s available context window is consumed by a single request. The context window is shared across system prompts, conversation history, retrieved context, user input, and the model’s generated output.
2. Cost Metrics
Cost is no longer measured by API calls alone. AI platforms price requests based on the resources consumed throughout inference.
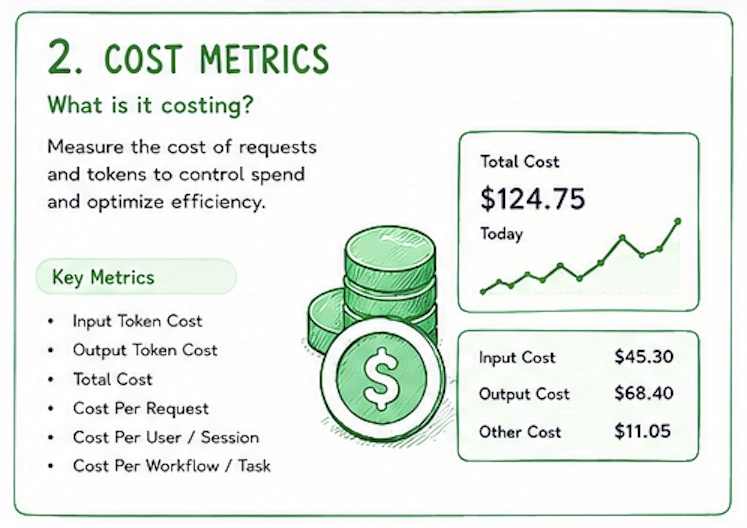
Total Cost ≈ (Input Tokens × Input Rate) + (Output Tokens × Output Rate) + Cached Tokens + Reasoning Compute + Modality Charges
AI pricing is closely tied to inference architecture.
Input tokens benefit from parallel processing during the prefill stage, whereas output tokens are generated autoregressively, one token at a time, making decoding slower and more compute-intensive.
Prefill stage is where the model reads the input prompt by tokenizing it, processing it through the transformer, and building the KV cache for efficient token generation.
Prompt caching reduces cost by reusing the model's KV cache, avoiding repeated computation for unchanged prompt prefixes.
Batch APIs are often discounted because providers can execute many independent requests together, keeping GPUs busier and spreading infrastructure costs across multiple workloads.
3. Performance Metrics
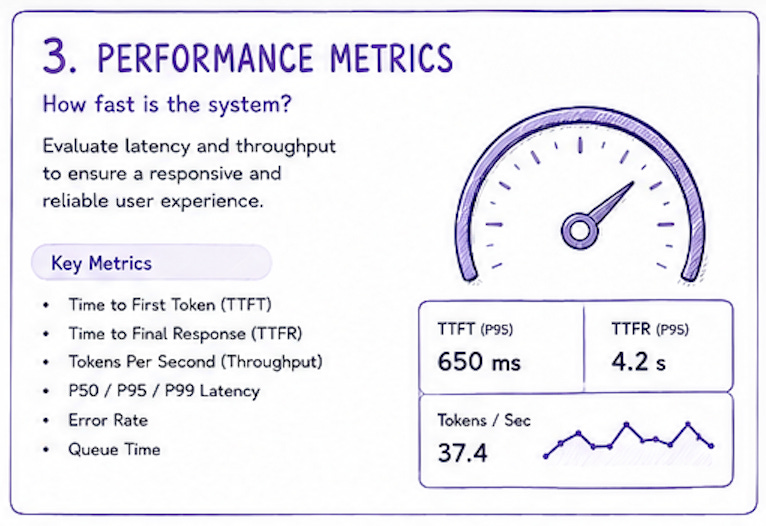
TTFT (Time to First Token) is the “cold start” of every prompt.
It captures nearly all of the work performed before generation begins, including request routing, prompt tokenization, GPU scheduling, prompt processing (prefill), KV cache construction, and the first decoding step. Once the first token is generated, subsequent tokens are typically streamed much faster.
Factors that influence TTFT include:
Request queue priority: Higher-tier or enterprise customers may receive higher scheduling priority during periods of high demand.
Dedicated or reserved capacity: Enterprise plans may have reserved inference capacity, reducing queue time and improving latency consistency.
Dynamic load balancing: Providers route requests to available inference servers, so TTFT can fluctuate based on current system utilization.
Model warmness: A recently used model replica may respond faster than one that needs to be initialized or loaded.
4. Context Metrics
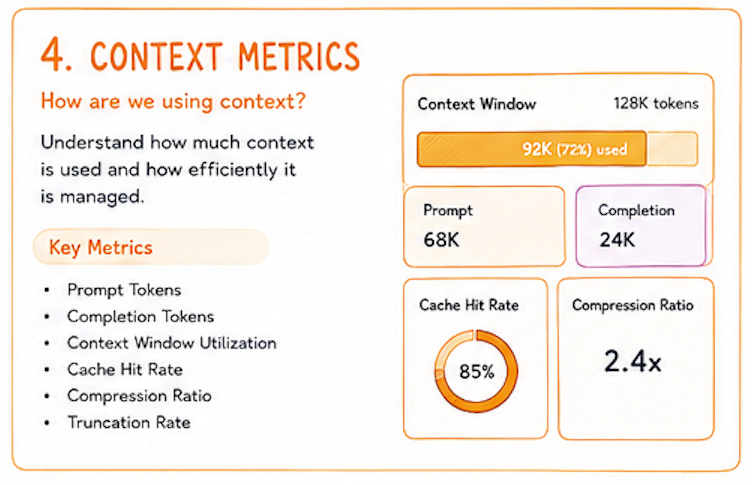
One common misconception is that larger context windows automatically produce better responses. In reality, the context window represents the model's working memory, where every token competes for attention during inference.
As context grows, irrelevant conversation history, redundant retrieval results, and verbose tool outputs increase noise, making it harder for the model to focus on the most relevant information.
If you're interested in understanding how context windows actually work under the hood, I highly recommend the video below.
5. Retrieval Metrics
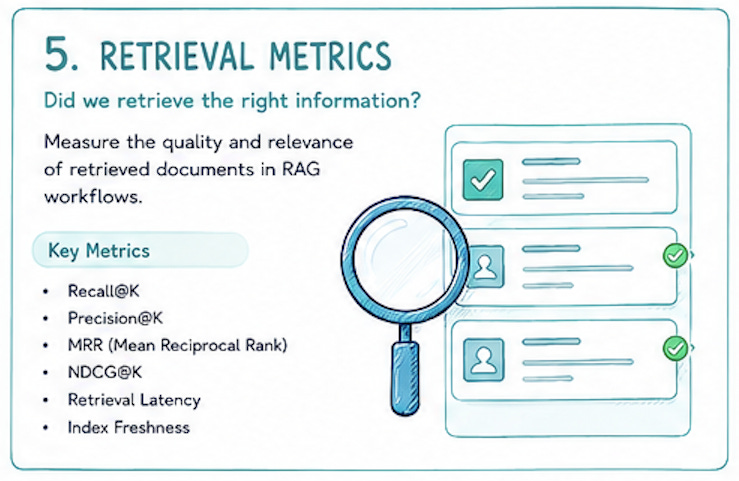
Retrieval metrics evaluate whether the right information reaches the model before inference begins.
In RAG systems, retrieval often determines the upper bound on answer quality. if relevant documents are never retrieved, even the most capable model cannot reason over information it never received.
For this reason, metrics such as Recall@K, Precision@K, MRR, and retrieval latency are often more valuable for improving production systems than simply upgrading to a larger model.
The mechanics behind these metrics are a topic on their own, so I'll save that discussion for a separate article.
6. Quality Metrics
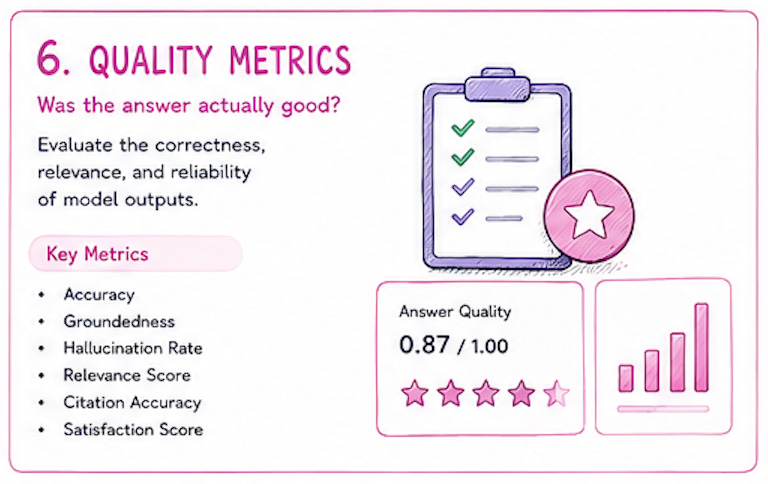
Quality metrics measure how effectively an AI system performs a task rather than whether its output is simply correct.
Since LLMs generate probabilistic responses, quality is evaluated across multiple dimensions including correctness, relevance, groundedness, faithfulness, and hallucination rate instead of a single pass/fail result.
Quality evaluation typically happens in two stages. Offline evaluation uses benchmark datasets and predefined test cases to validate models before deployment, while online evaluation continuously monitors production traffic using user feedback, human review, A/B testing, or LLM-as-a-judge evaluators to detect quality regressions over time.
7. Agent Metrics
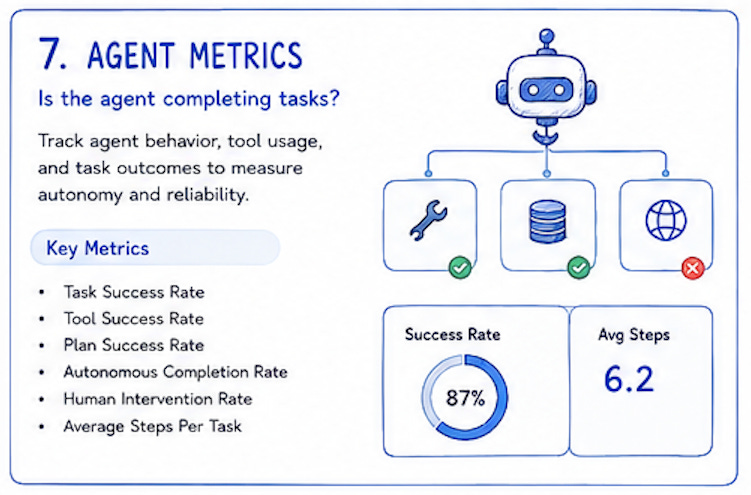
Agent metrics evaluate the overall effectiveness of an autonomous system in achieving user goals. Rather than measuring individual components such as retrieval, reasoning, or tool execution, they assess the final outcome of an end-to-end workflow.
These metrics provide a high-level view of an agent's autonomy, reliability, and ability to complete tasks, while lower-level metrics help explain why a task succeeded or failed.
8. Infrastructure Metrics
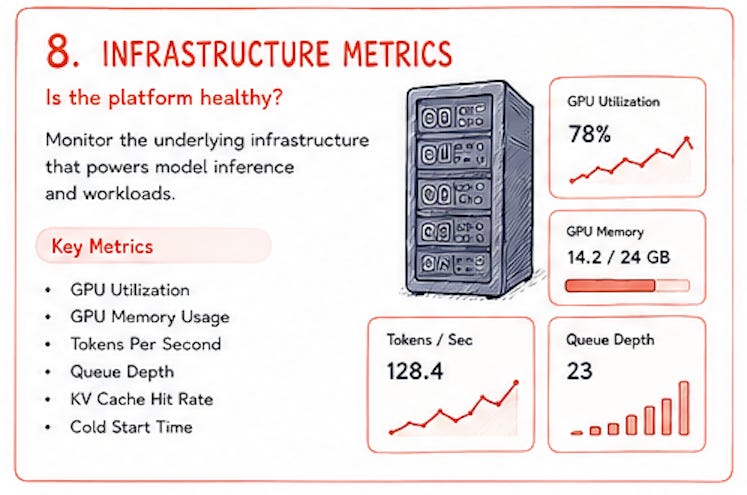
Infrastructure metrics monitor the health and efficiency of the platform serving AI workloads rather than the model itself. In production environments, these metrics are often the first indicators of capacity constraints, increased latency, or declining throughput.
9. Product Metrics
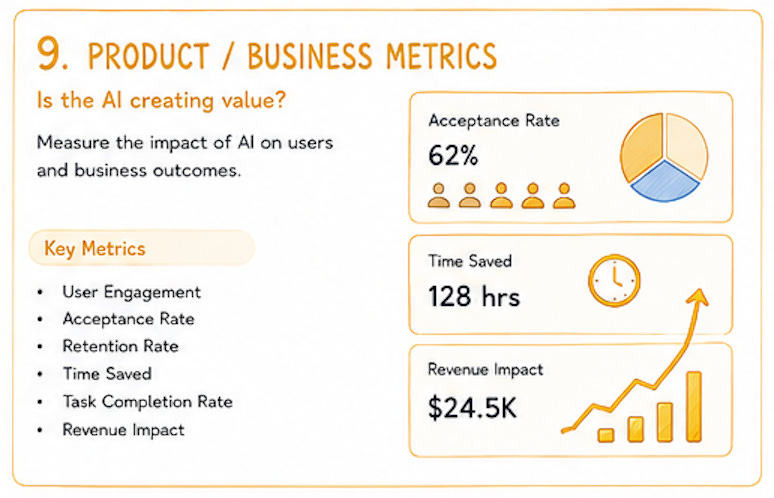
Ultimately, every AI metric exists to improve a business outcome.
Infrastructure, performance, context, retrieval, quality, and agent metrics help engineers understand and optimize AI systems, but product metrics answer the question that matters most: Is AI creating measurable value?
In practice, these metrics define the ROI of AI and increasingly drive investment decisions, product strategy, and the broader AI economy.
In the next article, we’ll move from concepts to implementation by building a simple AI metrics pipeline to collect, emit, store, and visualize these metrics from real AI applications.
Thank you for the blog , very interesting read and that video link was really helpful to understand the context window aspect in detail.
Would also be interesting if there is a separate detailed article about Quality metrics .